2025 Dataset now available — England's latest indicators

Data to Impact Through Insight

The Place Insight Index helps local authorities and analysts turn benchmark data, maps, and comparison tools into confident decisions across England.

Covering all of England
294 Local Authority Areas
2021–2025 Annual Data
8+ Indicator Domains
Census 2021 Population Profiles
Benchmark Geographic Views
Free Place Score · 2025 Data

See your local authority's Place Insight score

Search any English local authority to preview the four 2025 pillar scores. The deeper trends and comparisons stay locked for the full platform.

Popular searches
🔒v2.placeinsight.co.uk/benchmark/home
Understanding the Place Insight Index
Visualise England's indicators and outcomes from 2021 to 2025
Explore Map
Deep dive into local authority data through interactive maps and spatial visualisers.
Launch Map →
Compare Regions
Benchmark local performance against regional averages across multiple years.
Start Comparison →
How to use the platform
1. Select Indicators
Choose the data you want to explore.
2. Explore Regions & Time
See how indicators change across regions and over time.
3. Compare Differences
Understand differences and trends between areas.
Platform Features

Everything you need to understand Place Insight

From benchmark navigation to geographic comparison and population profiles, every view is designed to make place-based context easier to read.

🗺️
Geographic Comparison
Keep the same visual structure as the reference design while foregrounding geographic comparison as a core journey into the product.
Geographic Comparison
Index
Region
2025
North West
82
Yorkshire
74
West Midlands
68
PlaceInsight Area
88
South East
79
📍
UK Map Preview
Preview place-based context with a map-led view that mirrors the benchmark workspace.
Map preview
📊
Indicator Trends
Bring chart-led storytelling into the landing page without making the page itself functional.
👥
Population Profile Snapshot
A lightweight preview of the benchmark population-profile pages, keeping the editorial style and dashboard composition from the reference HTML.
Resident population
92,340
Median age
39.6
0–17
19%
18–64
61%
65+
20%
Geographic Comparison

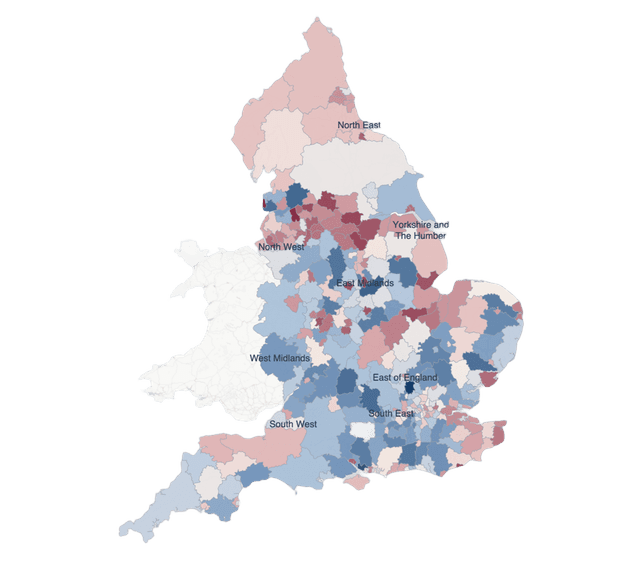
Compare areas with a cleaner regional view

The landing page keeps the original HTML design language while showcasing the benchmark journey that matters most here: selecting indicators, reading geographic distributions, and comparing local areas side by side.

Same elegant layout direction as the provided reference HTML.
No “turn data into anything” messaging.
Strong benchmark-first storytelling for local authority users.
Regional benchmark view
Health
North East
Bar chart
North West
82
Yorkshire
74
West Midlands
68
PlaceInsight Area
88
South East
79
Place Insight Index
Explore benchmark views with a more focused landing experience
Open the benchmark workspace, compare regions, and explore the full Place Insight subscription on the pricing page.